
Data-Driven EU Affairs
How OSINT & Machine Learning Can Amplify EU Affairs Strategies.

For over fifteen years, we’ve been driving public affairs strategies powered by machine learning and open-source intelligence. This document explains the techniques we employ that enable our clients to identify and analyze EU policy trends 100-1000 times faster than traditional approaches, while surfacing insights that would remain undiscoverable through conventional desk research and intuition alone.
Domain Analysis™
Our main process that we designed and implement at the EU, Walmart and HSBC is process called “Domain Analysis™. This technique leverages machine learning, OSINT, and alternative data to extract market or trends insights on any policy, institution, policymakers across thousands of signals from news articles, search patterns, web traffic, economic and market trends and social media. We then employ machine learning—natural language processing in particular—to identify connections between data points. These revealed trends inform our strategy development using concrete data, not just intuition or experience. As a result, the analysis provides a comprehensive overview of any policy landscape and identifies potential risks and opportunities that might otherwise remain hidden.

Advantages:
Stress-tests strategic hypotheses, i.e., “this is connected or important to that” in hours, not months, before making large investments in time, assets, and resources.
See all the intelligence on a topic or issue structured in the context of all the information available, not just a few news articles or data points. Personal and biased information feedback loops are filtered out at the beginning resulting in “cleaner” and less noise within the information.
Analytically measure “Soft” trends, such as political events or regulatory risk, not intuition.
Policy Indices
Much like how a stock trader looks at asset/stock prices, it's also possible to create what we call “policy indices,” which track online mentions related to the policy in question enabling public affairs teams to rank and model emerging trends. The data can come from various sources such as Twitter, news, blogs, and forums like Reddit or Google Search Trends. Below the chart is looking at total mentions across all channels of the policies areas in the top right of the chart. EU Digital Sovereignty and Cloud computing appear to generate the most engagement (mentions) in March and May of 2022.

Correlation Matrices
Taking the same dataset, we can apply regression analysis to identify which domains (topics) exhibit the strongest correlations. Matrix correlation charts, like the one displayed below, are frequently utilized in finance and economics to visualize relationships between multiple variables and inform data-driven decisions. These visualizations excel at revealing trends and patterns within large datasets, enabling researchers and analysts to comprehend complex relationships among dozens of variables (equivalent to multiple columns in Excel).
Correlation Matrix of Policy Areas Related to Digital Sovereignty

The correlation matrix quantifies both the strength and direction of relationships between variable pairs, with values ranging from -1 to 1:
A coefficient of 1 represents a perfect positive correlation, indicating two variables that are strongly related and move in the same direction.
A coefficient of -1 indicates a perfect negative correlation, showing two variables that are strongly related but move in opposite directions.
A coefficient of 0 signifies no correlation between the variables.
The insights can then inform your advocacy strategy planning. For example, the matrix chart above reveals that Chips have a stronger correlation to Digital Sovereignty (.52) than to Cloud Computing (.12). This suggests that when advocating for increased computer chip manufacturing sites, emphasizing benefits to Digital Sovereignty would be more effective than focusing on cloud computing narratives.
Similarly, this data can help measure the proximity between a company's position and other policy areas of interest, allowing you to reverse-engineer the most efficient pathways for embedding your campaign within those policy domains.
Why This Analysis Technique Matters:
Identify competing or connected policies vying for stakeholder attention.
Create strategic topic correlations—for example, when AI trends upward, naturally incorporate related policy areas like cloud computing or quantum technology into the broader AI discussion.
Optimize resources by developing integrated strategies across highly correlated policy domains, reducing both time and financial investments.
Evaluate communication effectiveness by tracking how your specific topic's correlation with priority policy conversations evolves over time.
Machine Learning
Once policy indices are established and correlated, this data powers an "influence model" using machine learning to rank variables by predictive strength. Our analysis reveals Chips, Cloud Computing, and AI as the dominant second-order narratives linked to Digital Sovereignty across Twitter, News, and Blogs.
This methodology transcends simple correlation—inverse relationships can be equally significant in influence rankings, as these models identify influential factors regardless of directional relationships. Policy environments represent complex, interconnected systems where influence patterns rarely follow linear trajectories. While traditional correlation analysis has served public affairs analytics for years, it captures only a partial picture, frequently missing the critical non-linear dynamics that truly shape policy outcomes.
Influence of Sub-Policies on Digital Sovereignty

Machine learning modeling represents a fundamental advancement over basic correlation analysis for several important reasons that are particularly relevant to sophisticated public affairs work. While correlation analysis can identify basic linear relationships between variables, policy and regulatory environments are inherently non-linear systems. A simple example helps illustrate this limitation: a correlation metric might show a strong relationship between increased lobbying expenditure and favorable policy outcomes up to a certain threshold, after which additional spending yields diminishing or even negative returns. Standard correlation would miss this inflection point entirely.
Furthermore, correlation struggles with complex multivariate scenarios where dozens or hundreds of factors simultaneously influence outcomes—precisely the environment public affairs professionals navigate daily. In these settings, correlation can lead to spurious conclusions by highlighting meaningless statistical relationships while obscuring more meaningful but complex patterns.
Machine Learning Advantage In Public Affairs
Pattern recognition across high-dimensional spaces: ML models can identify patterns across dozens or hundreds of variables simultaneously, detecting subtle relationships that would remain invisible to correlation analysis.
Interaction detection: ML algorithms automatically identify how multiple factors interact to produce outcomes, such as how the combination of timing, messaging framing, and stakeholder positioning collectively influence policy receptiveness.
Temporal dynamics modeling: Advanced ML approaches can capture time-lagged effects where today's messaging influences next month's policy outcomes—critical for understanding advocacy effectiveness.
Threshold detection: ML models automatically identify inflection points where relationships fundamentally change, such as when regulatory scrutiny suddenly intensifies after passing a certain public attention threshold.
Real-World Impact in Public Affairs
In practice, our enhanced analytical techniques using machine learning delivers tangible strategic advantages over statistical analysis alone.
Revealing Hidden Patterns
A recent bridge_ci project analyzing EU regulatory receptiveness illustrates this distinction. While traditional correlation analysis identified moderate relationships between messaging approaches and policy support, our machine learning model uncovered critical timing dynamics—revealing that regulatory receptiveness spiked immediately following economic data releases, but only when combined with specific policy framings. This complex, non-linear relationship would have remained invisible using conventional analytical methods.
Detecting Pivotal Shifts
Machine learning excels at identifying sudden changes in policy influence patterns. For a financial services client, our ML models detected a fundamental shift in regulatory influence dynamics following a personnel change at a key EU institution—recognizing a complete reorganization of the influence landscape well before traditional analysis could identify the transformation.
Precision Targeting
The difference in analytical power directly translates to strategic advantage. While correlation might indicate a stakeholder's general support level, machine learning reveals when they're most receptive, their preferred channels, and which specific message framing resonates—enabling precision in public affairs strategy unattainable through correlation alone.
Channel Optimization
These same techniques enhance channel influence learning, determining where and when public policy teams should communicate their messages. Once established, these analytical frameworks identify the most effective influence channels across platforms like websites, Twitter, online advertising, and Reddit. By analyzing these channels comprehensively, we determine which are most effective in shaping public opinion and driving engagement. For example, our analysis demonstrates that Reddit and blogs serve as the most influential channels for Google searches about the European Parliament.
Channel Impact In Driving Google Searches of EU Institutions

By leveraging these advanced capabilities, organizations develop more sophisticated, targeted strategies that account for the complex, non-linear realities of policy influence—moving beyond the "what" of correlation to understand the crucial "how," "when," and "why" of effective public affairs.
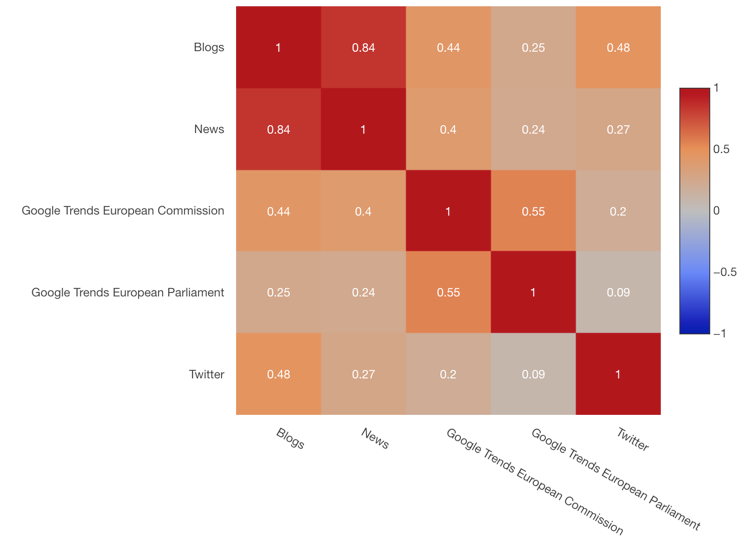
This information can be highly valuable in allocating time, ad spend, or other resources to each channel, depending on the specific goals or objectives. It is worth noting that each policy area has a unique dynamic regarding how information is dispersed and consumed. Our data also highlights that Twitter and News have limited influence in this context, suggesting that they operate as largely separate media ecosystems in their own right. By utilizing this type of analysis, we can better understand the various channels of influence and design effective communication strategies that reach the right audience through the most impactful channels. And just like the policy indices mentioned, each channel can be correlated to one another for further insights into channel engagement drivers (chart below).
Channel Correlation Matrix
Network Analysis
At bridge_ci, network analysis is our flagship technique, distinctly setting us apart from other firms through our deep understanding of network science and graph analysis. We believe that networks, while inherently complex (because they reflect our complex world), offer the most effective way to understand relationships between topics or entities (people, places, regions, organizations) within multifaceted systems.
The network visualization below clusters European Commission official communications based on topical similarities. More closely related topics appear connected or embedded with one another, while topics without shared policy themes or key sub-domains remain distant. For instance, the visualization clearly demonstrates that democracy clusters are disconnected from energy or cell research clusters at the bottom.
European Commission Official (Europa) Communications Network

This powerful analytical approach enables you to:
Establish your starting position by measuring how deeply your issue is embedded within target conversations
Identify the critical topics or policies that "bridge" different areas of interest
Conduct post-campaign assessment to analyze how your policy issues gain centrality following advocacy initiatives
Based on our network analysis, organizations advocating for democracy when engaging EU policymakers should emphasize the relationship between energy policies and democratic deficits or human rights concerns in energy-producing states. This strategic approach bridges two distinct conversation clusters. The data indicates that innovation, resilience, and recovery serve as critical connecting themes that can effectively link these policy discussions, providing advocates with clear pathways for more impactful communication strategies.
Zooming in on the Network (Same Europa Data from Prior Network )

Entity Extraction Networks e.g. Stakeholder Mapping
Algorithms can also identify the people, places, and regions that are important. This can help to give a more accurate picture of public opinion on certain issues and can help to identify any potential areas of concern. This is next-generation stakeholder mapping that can be done in real-time versus months or weeks using traditional desk research.
Entity Networks e.g. Stakeholder Mapping (Same Data as Prior Networks)

Machine Summarization
Since 2015, we have pioneered the use of advanced natural language processing techniques, including first-generation Large Language Models (LLMs), well before Generative AI became a household term. This expertise has enabled us to automatically summarize hundreds of documents and extract valuable insights on specific policy domains, as demonstrated in our analysis of "EU Energy Prices" below.
This methodology offers significant advantages over traditional human-curated research and has only improved with the advent of modern LLMs. While individual searches often lead to personalized results with inherent bias, these systems analyze all available content on a given issue—including news articles, social media posts, and research papers—providing comprehensive context rather than isolated viewpoints.
This approach results in monitoring systems that deliver immediate insights into public issues in real time, without hallucinations. These systems can structure complex events chronologically as they unfold, and in more sophisticated applications, utilize timestamps and classifiers to build predictive models for political outcomes—similar to how hedge funds model stock market behavior.
The benefits of using data-driven public affairs techniques are clear: more efficient decision-making, increased accuracy in advocacy campaigns, and a better understanding of the EU trends and policy ranking or the sub thematic associated with them. Ultimately, data-driven EU affairs insights make the EU policy landscape more accessible to EU advocacy teams – leading to better decision-making and improved outcomes.