
Open-Source Intelligence (OSINT) & Alternative Data
What Is Open Source Intelligence & Alternative Data and How It Can Be Used.

Throughout my career at organizations such as Walmart, HSBC, and the EU, my first priority was consistently spearheading the development of open-source intelligence (OSINT) and alternative data capabilities. By strategically harnessing these external data sources and integrating them with internal data and machine/augmented intelligence frameworks, we gained invaluable insights into market realities, opportunities, and risks—all at a fraction of the cost and time required by traditional research or consulting services. The resulting intelligence informed strategies and insights that were not only more closely aligned with rapidly changing market dynamics but also delivered at a pace that far exceeded what was achievable through internal data or intuition alone.
Open-source intelligence (OSINT) is a type of intelligence that uses publicly available information. Some examples are news articles, social media, economic, governmental & market data, 10k filings, government policies, government records, or open-sourced corporate data such as Google search trends.
Alternative data can be signals from web traffic and transactional data such as shopping and spending patterns by region, type of good, and type of consumer, as well as satellite images to regional growth or trade levels.
The key difference between alternative data and OSINT is that alternative data is private and not publically available. That said, even though OSINT is technically free and accessible, in most cases makes sense to buy it formatted and cleaned to enable faster analysis. Combined, these data points can help companies identify emerging trends and changes in the market, providing an additional layer of insights not possible with internal data alone. When combined with internal data (what we call the “holy grail”), a firm will get an unrivaled 360-degree lens of everything.
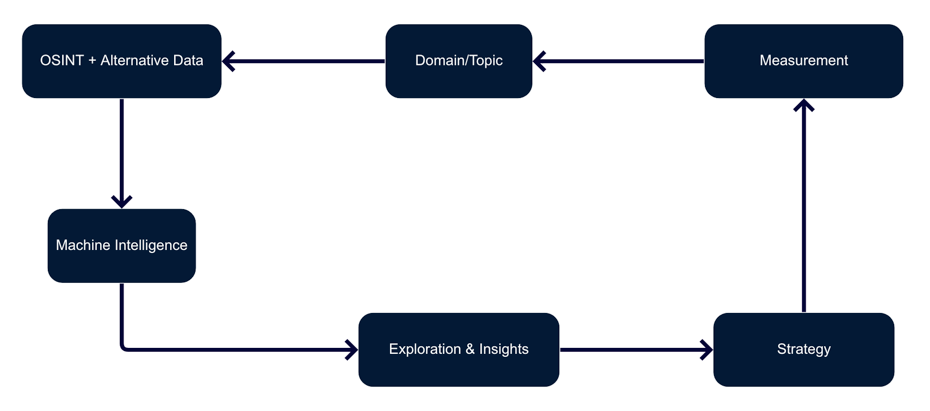
Once the data is in place, it’s possible to implement a technique called a “domain analysis,” which uses machine learning and augmented intelligence to analyze the massive amounts of data from OSINT, alternative, and internal data when it’s available. The technique can be used in simple or complex situations and will enrich any strategic decision.
Advantages
Save resources and time by finding patterns between products, events, markets, trends, and people, of the world’s collective knowledge before deciding what to prioritize and to invest in.
Less prone to biased, more contextual, and faster than heuristics.
Intelligence is cheaper and quicker than internal data, business expertise, or external consultants.
No wait times for internal, often outdated data. Insights on any topic from OSINT can be immediately collected and acted on.

At most firms, strategy and priorities are set by the most senior executives and their teams. After that, analysts gather information and data to diagnose or enrich the initial strategy's lens. It's almost certain that this process will leverage both Google search and Excel spreadsheets and, in some cases, a business intelligence dashboard. Most of the time, the data only contains financials or market share comparisons of revenue streams. While Google delivers relevant search results and financial fundamentals that can show the validity of a market or business, it is still up to humans to contextualize all the information to access the strategy's merits.
There are major issues with this approach:
Information is distorted by each teammate's individualized Google search results, in addition to news and social media feeds, leading to no coherent center of truth.
The strategy is anchored by currently known information. Peripheral trends, which are unknown, that influence outcomes - call this "dark matter," are ignored/unknown.
Excel doesn't do a good job of contextualizing multiple data streams, and fundamental data alone is just the tip of the iceberg.
As such, companies have a hard time making sense of the system of the market they are targeting. They favor defined albeit superficial intelligence that confirms pre-existing strategies and then optimizes them VS actively seeking to find flaws in the thesis and new opportunities for value creation. It is a core reason why all but a few businesses often appear tone-deaf, and many are upended daily by market volatility or disruption from competitive forces.

Legacy V Zero Assumption (Domain Analysis)
Given the strategy is human-driven, analytics are typically only brought used after a strategy is being executed. And in doing so, the option to refine the strategy using a data-driven approach is only available at the next implementation. By doing the former, firms have difficulty creating value. Data science is applied inherently to already known information or processes, creating an "optimization trap," as I call it. The former does not attempt to create value in any novel way from multiple signals before setting the strategy. Making uncompetitive products, all at an inflated cost - both monetary and temporal.

Outside of the topic in question, i.e., "Belt and Road”, “Green Finance,” or "Transition Bonds," a domain analysis start with zero assumptions about the core focus or topics for prioritization. They are, instead, using machines to find signals within open-source and alternative data to anchor the strategic priorities within the said domain. Taking this approach leads to less bias, faster intelligence, and more precision than experience alone ever could. Combined with human expertise, the technique produces unrivaled outputs, as humans alone lack the requisite processing power to consider all relevant variables which machines can easily compute.
Domain Analysis
An excellent example of how the process works is using advanced natural language processing and network analytics to cluster OSINT documents that mention “Global Risk” before the COVID outbreak. The domain analysis methodology quickly surfaced that pandemics were central to the broader domain (“Global Risk”), thus should be focused on, as well as how it is connected to more obvious narratives such as recession, oil, and the USD. While the intelligence wouldn’t have stopped the COVID epidemic, at the minimum, companies would have been better prepared and bought themselves time.

Furthermore, OSINT data from the World Bank and topological data analysis surfaced that Germany, Austria, and France were the most robust countries against COVID. And these economies would probably open up sooner. Additionally, a review of Google Search Trends shows the markets perhaps believe the FTSE is the most exposed exchange because of the high correlation Google search correlation with the VIX volatility index during the COVID pandemic due to the additional concerns over how the UK economy can cope with the combination of QE policies and Brexit post-lockdown. A two-week lead time can be worth hundreds of millions of dollars to a fund manager or corporate.

What Can Organizations Do?
Start Now
The best way to learn is by doing, and one of the greatest upsides of OSINT over other types of data is that it can be accessed and leveraged immediately, with an upside, as shown in the visual below.
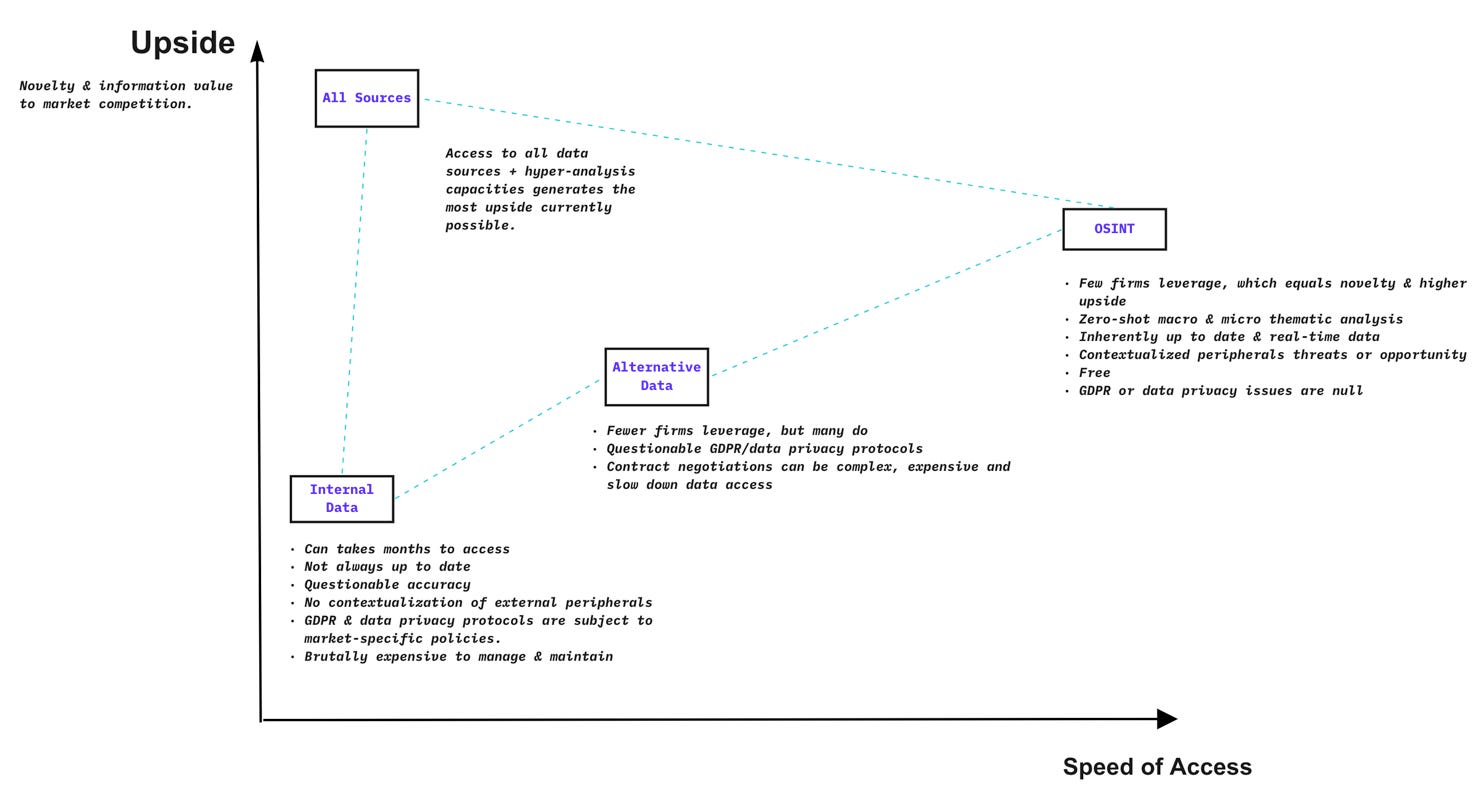
OSINT You Can Use Immediately
Google Trends is my first go-to in all cases. It’s simple, quickly allowing users to compare the relative search volume of searches between two or more terms. G Trends is a free tool and is an excellent example of open-sourced intelligence by a corporate. Search volume is extremely predictive in politics, retail, and finance - as it can be used as a leading, not lagging, indicator. One technique that can be valuable is looking at how different topics/keywords contrast or correlate to one another, i.e., holidays, flights, credit cards, and mortgages. Often businesses look at these products in siloes when a variety of factors influence them. Google trends can quickly quantify those hypotheses, especially for macroeconomic themes. Additionally, Google Trends has been deadly accurate in predicting electoral outcomes where the polls have failed, showing both Brexit and Trump coming out on top.

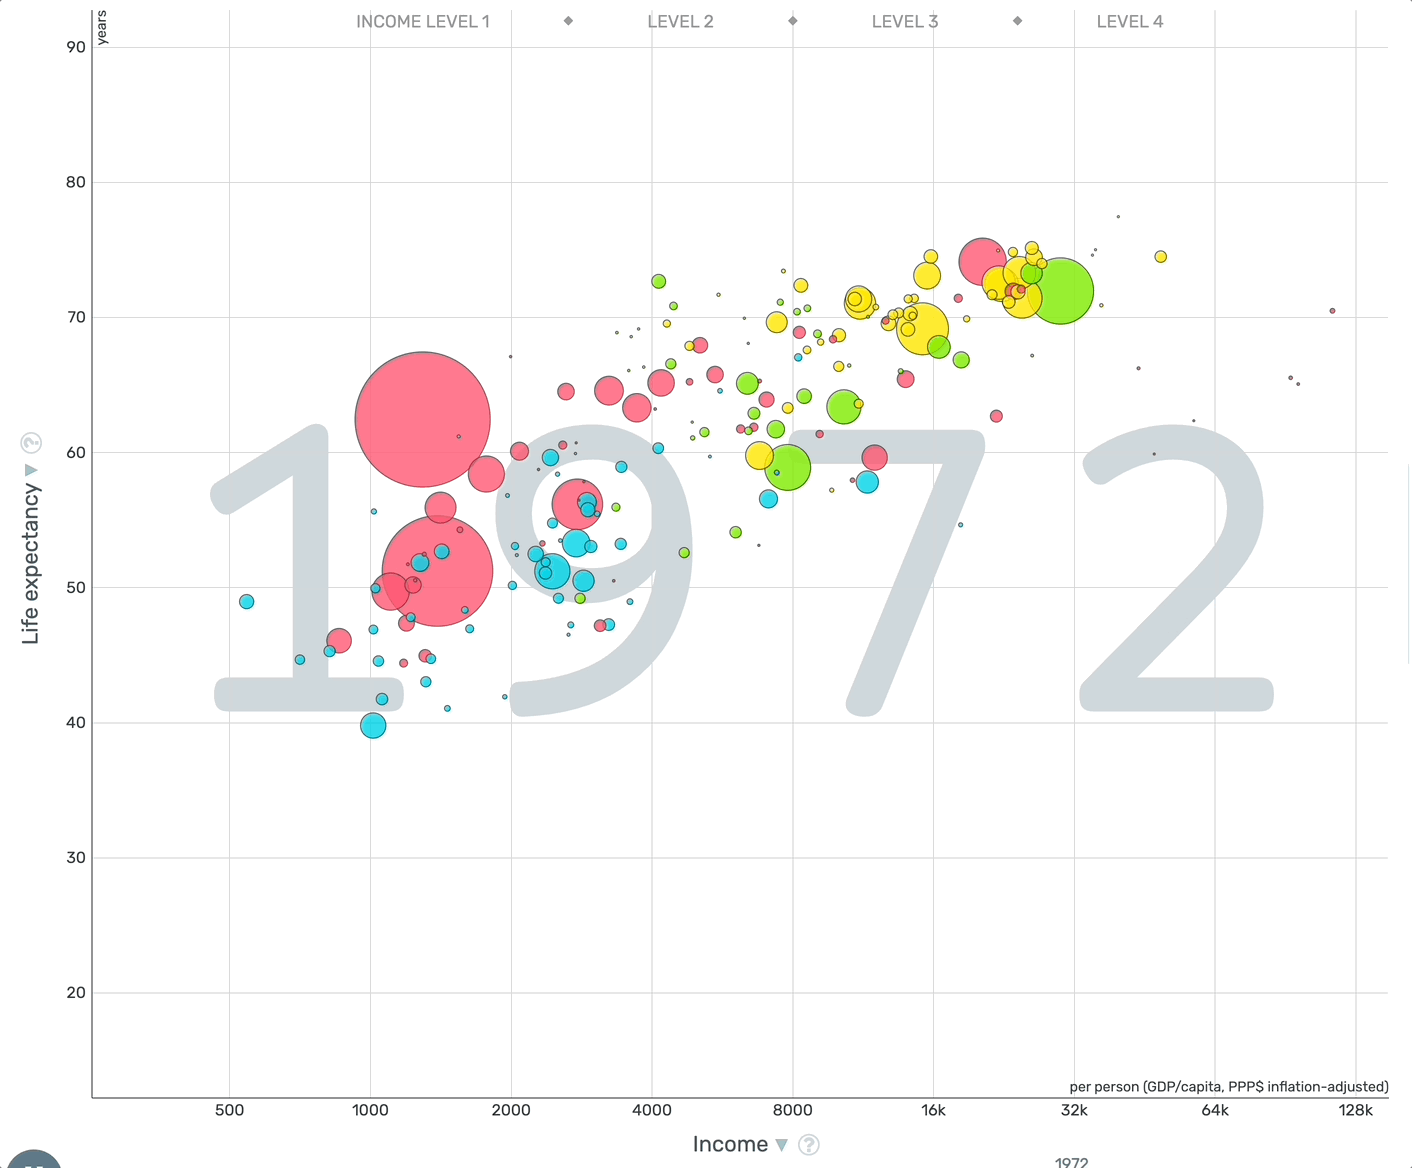
Governments and International Organizations. The World Bank and Eurostat offer data on a variety of topics, including economic indicators, social indicators, and environmental indicators. Nonetheless, I’d suggest using Google Public Data Explorer, which aggregates all these data in one place and offers great visualization tools based on the legendary Hans Rosling’s Gapminder - also a great resource (below). Moreover, open-source data can be found on the U.S. open data portal and in numerous other open-source repositories like Kaggle, where you can find datasets for anything from natural language processing to computer vision.
Wolfram Alpha is a computation tool that contains data such as GDP or population growth as well as entities, i.e., companies, places, or markets. It's a computational knowledge engine that answers factual queries directly by computing the answer from externally sourced "curated data" rather than providing a list of documents or web pages that might contain the solution as a search engine might. It’s a great way to access Morningstar data, as well as projections, which are below and show a downward HSBC and upward GS and JPM trend, which for most people in corporate strategy or investments, is good enough.

The Globe of Economic Complexity shows the true scale of the world economy. It visualizes 15 trillion dollars of world trade. One node equals 100 million dollars of exported products and shows how those product spaces and countries are interconnected. It's the best example of economic data and complex systems visualized in their full reality. If you are unfamiliar with graph analytics, look at the Atlas of Economic Complexity, which the examples below are from.

Management
Technology is only half the story. To get the most out of them, managers must think differently - most of these outputs will be new and abstract to an organization. And it can take some time for people to get their head around what’s possible and machines and alternative data sets.
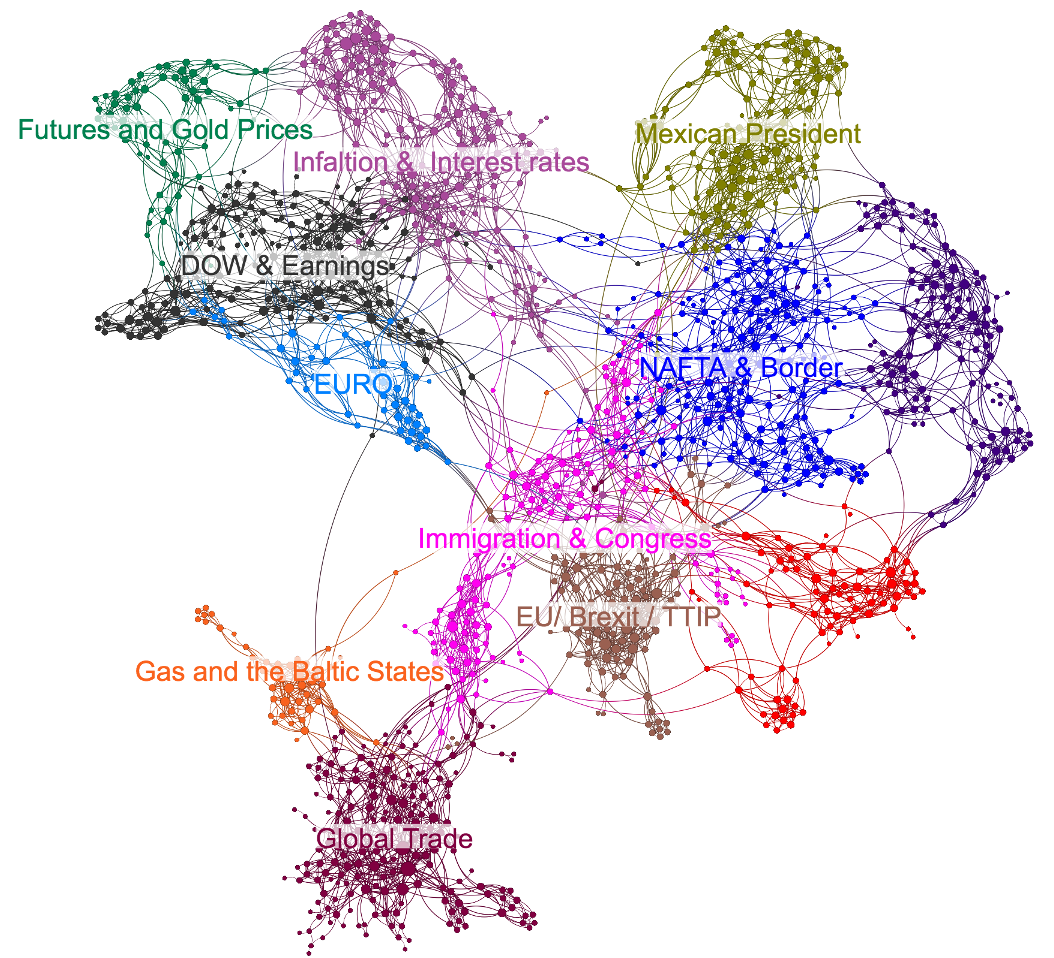
The Actual World Doesn’t Dashboard
The world is interconnected, ambiguous, and complex most of the time. As such, so are the data and outputs, as illustrated by the network below, which uses natural language processing to connect thematics from OSINT. Decision-makers should learn to defer judgment - not immediately revert to their heuristics if they do not understand machine-derived outputs. While humans crave black-white classification (like dashboards), accepting ambiguity and probabilistic thinking leads to better decisions.
How the Actual World Is
Understand the cost of indecision. Firms must be mindful that a "good" or "ok" decision's value is exponentially highest in the beginning – and often much more valuable than a perfect choice made later. This is due to the margins of a competitive edge becoming smaller but, at the same time, exponentially more valuable globally. As a result, focusing on developing decision architecture that focuses on lowering "information-to-action" times (similar to how traders look at financial markets) is essential and will be a driving competitive edge.

The level of expertise needed to beat machines gets higher every day. Managers must accept that the value of their expertise and insights from their information - often static, diminishes rapidly. Windows to exploit and or maintain a market position open and close faster than ever, and political disputes that can threaten a business strategy, along with new competition, seemingly emerge from nowhere. As such, over the next five to ten years, the most successful companies will place the burden of proof on human intuition, not data. Even when machines are wrong, they are consistently wrong for the same reasons, making them less noisy and easier to fix. Ask five people to rank the most important drivers of a given topic, say interest rates, and you will get five different rank orders. Machines don’t do that.
In short, there are a lot of applications for OSINT and alternative data, with more popping up every day. Firms must realize that their most valuable expertise will be synthesizing disparate signals in the data with machines that enhance their ability to find patterns and quickly pivot to where those lead. Not a specific expertise or knowledge base. The difference in outcomes will be as drastic as those of a captain who's mastered the use of a compass and map, compared to those who can only sail where there is a familiar shoreline when trying to reach the new world.
If you want to learn more about OSINT or have any questions feel free to reach out. I am passionate about this subject and helping firms get the most out of these technologies.