
SynthLens
Synthetic Focus Groups: Revolutionizing Communications & Marketing Research at a Fraction of Traditional Costs

SynthLens™ is bridge_ci's solution for synthetic message, content testing and product or political testing. It combines Generative AI, open-source intelligence, alternative data, and advanced mathematical analysis, forming a comprehensive testing platform. Unlike traditional tools that only use generative AI, SynthLens offers better results through:
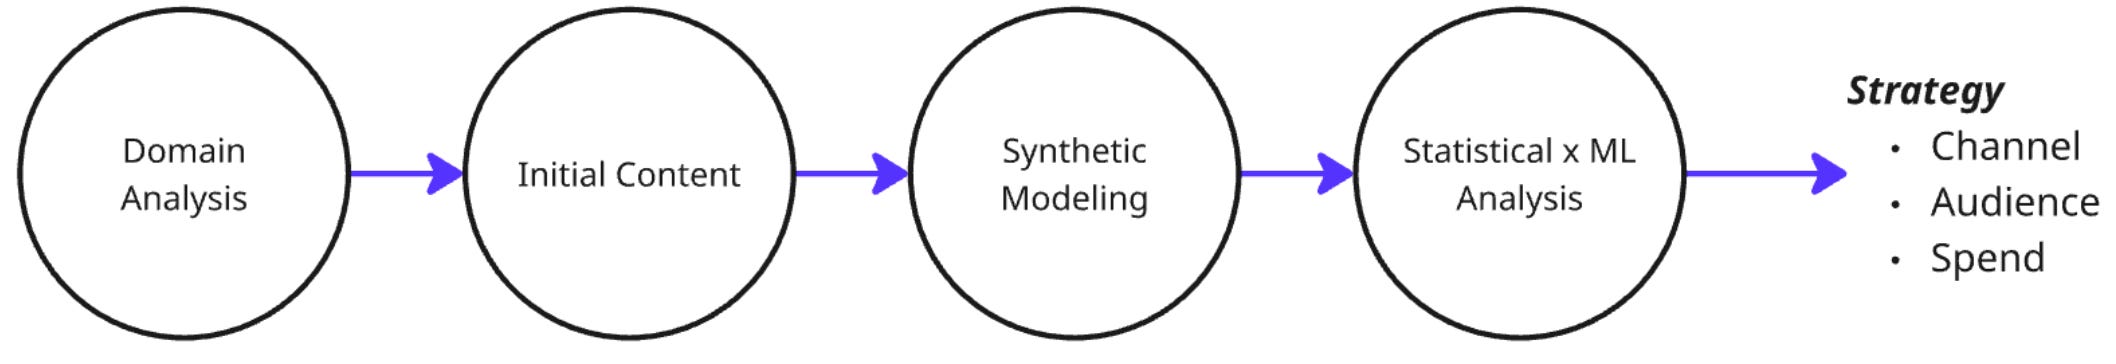
Integration of multiple data sources, including OSINT and alternative streams
Advanced mathematical modeling of synthetic data for improved pattern recognition
In-depth cause-and-effect analysis in messaging
Predictive analytics for message performance across more than 250 signals that classify message framing, topical trends, personality types across all channels
This approach allows organizations to test and optimize communications with unmatched accuracy. By synthesizing varied data and analytics, we score and analyze how different ad copy, papers or various communications resonate across a wide range of more than 250 demographic and psychographic variables, generating precise segmentation data that would be impossible to obtain with traditional focus groups. Further, synthetic focus groups provide scoring on a 1-100 scale (with decimal precision) for each ad concept across multiple dimensions.
This enables us to:
identify the strongest audience segments for each creative concept
optimize channel strategy
understand the psychological mechanisms that make certain ads more effective with specific audiences.
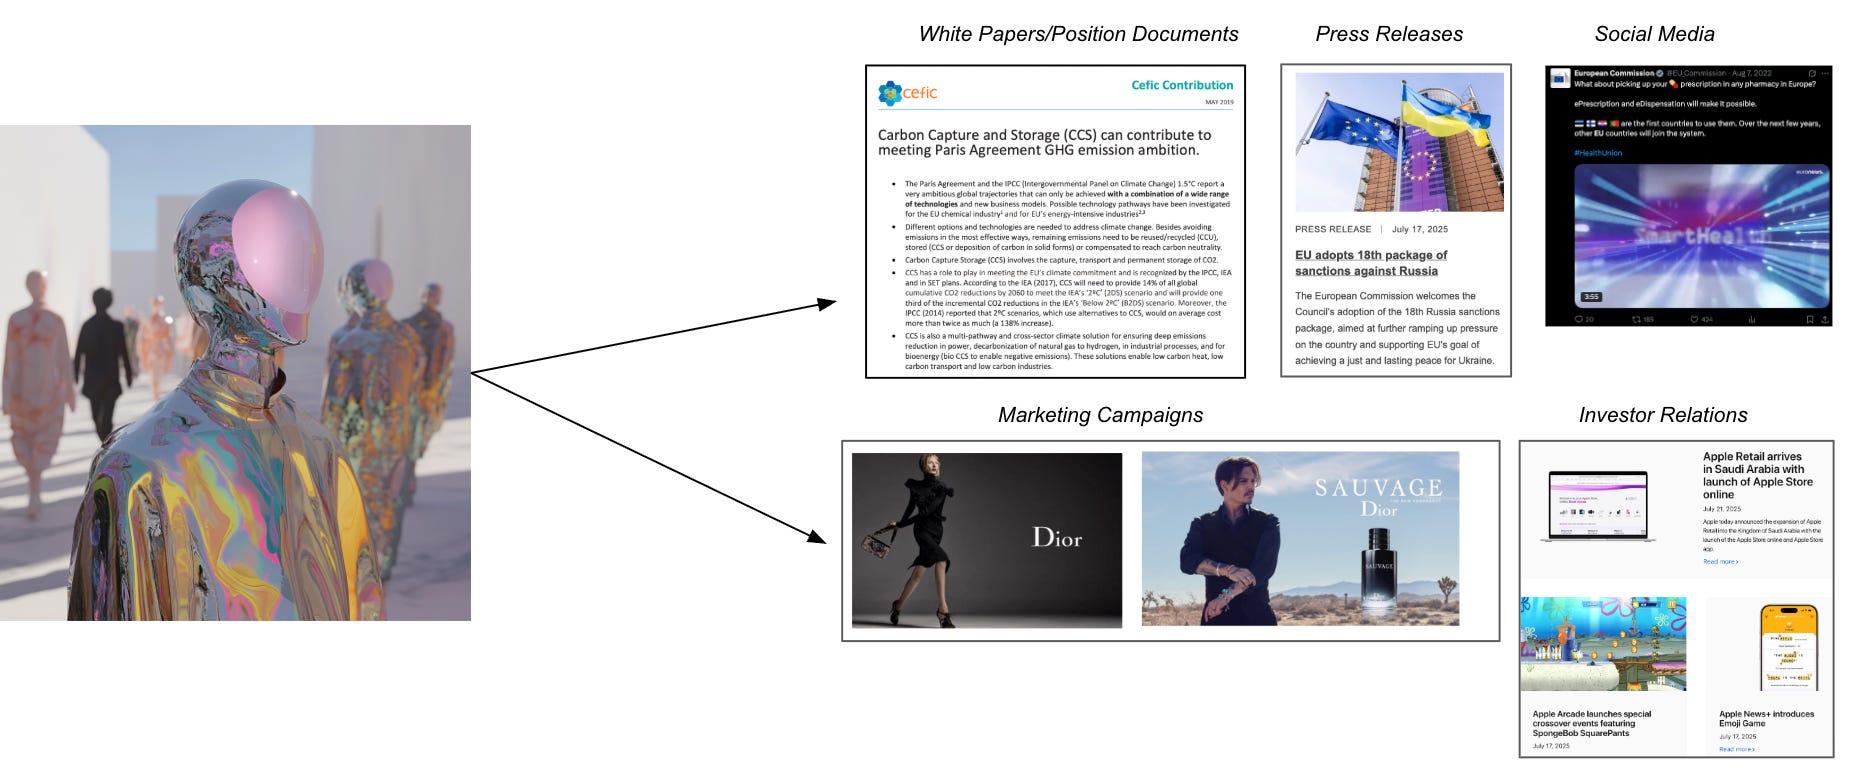
Examples
These tools can be applied across of range of public affairs, strategic communications, investor relations and general marketing organizations can use our synthetic focus groups to score and rank resonance of any campaign, content, white paper as well as identify what specific channel communications will resonate with the most.
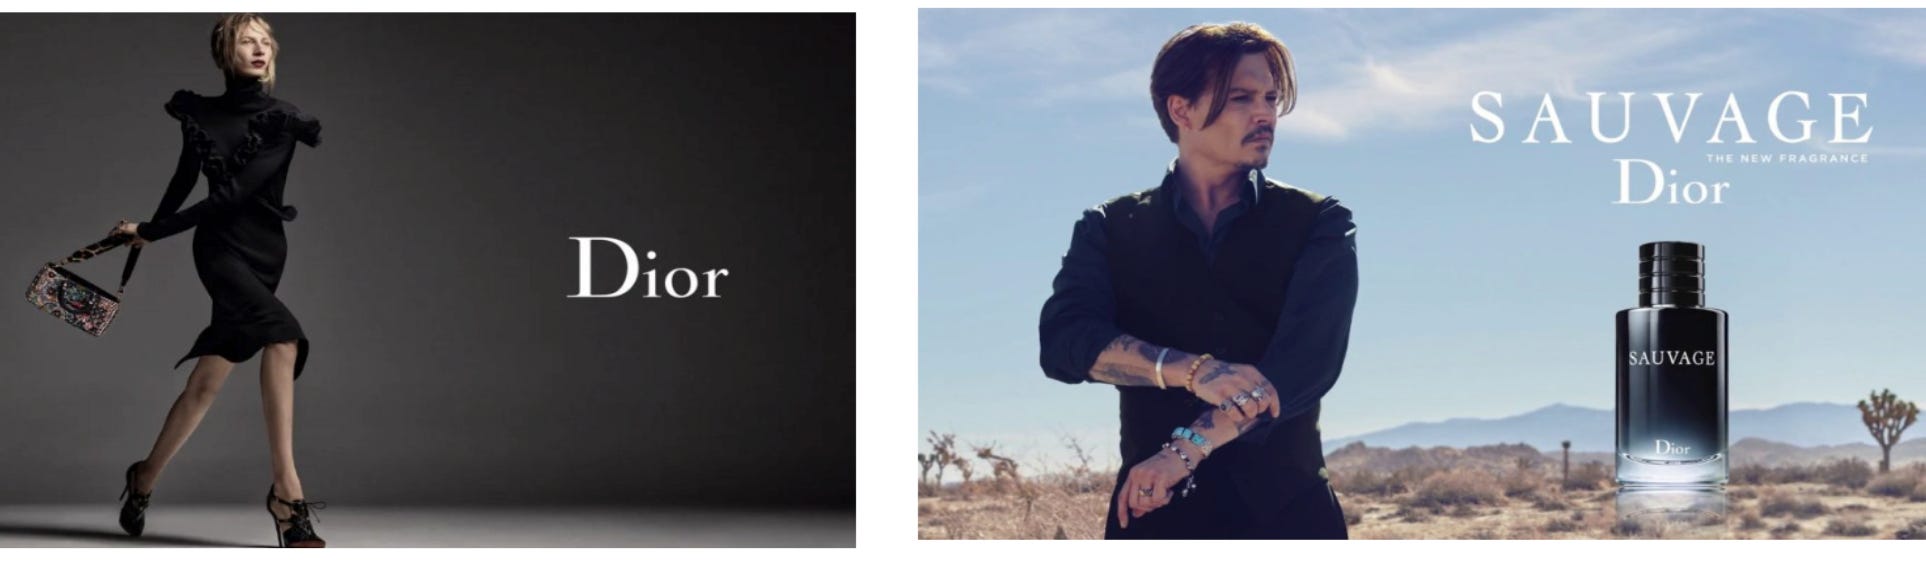
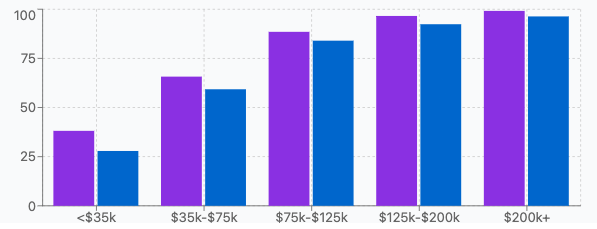
Dior - Income Performance
Dior - Age Resonance
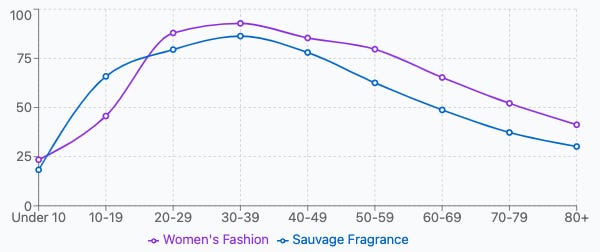
“The Dior Women's Fashion advertisement strongly resonates with affluent women aged 30-39 (92.81) and those with higher incomes ($125,000-$149,999: 95.34), particularly in urban/metropolitan areas (94.72). It performs exceptionally well on visual platforms promoting "like" engagement (91.42) and purchase intent (87.65). The ad appeals most to economically conservative individuals (87.58) and shows strong performance among female family members.
The Dior Sauvage Fragrance advertisement featuring a male model appeals strongly to men aged 30-39 (86.32) and high-income demographics, with particularly strong resonance among fathers (85.91) and brothers (78.63). It performs best on YouTube (89.73) and generates strong follow engagement (87.46). The ad shows balanced appeal across political spectrums with slight preference among socially progressive individuals (79.82).”
Notable Statistical Outliers
The women's fashion ad scores extremely high (99.63) among the highest income bracket ($500,000+)
The Sauvage fragrance shows a significant gender-specific appeal pattern (85.91 for dads vs. 42.63 for moms)
Both ads show strong urban/metropolitan preference (94.72 and 87.53) compared to other regions
The fashion ad shows a 50.38 point gap between highest income bracket (99.63) and lowest (32.45)
In addition, it's possible to test the specific channel that each campaign will resonate across a variety of demographics such as age, income, regions and channels.
Dior - Channel Performance
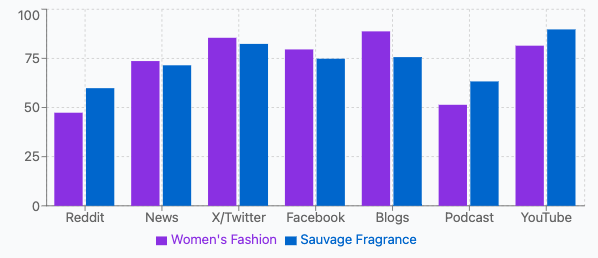
The channel analysis shows that the Women's Fashion ad performs best on Blogs (88.73) and X/Twitter (85.47), while the Sauvage Fragrance ad achieves its highest scores on YouTube (89.73) and X/Twitter (82.36).
The Sauvage ad notably outperforms the Women's Fashion ad on Reddit (59.84 vs 47.35) and Podcasts (63.27 vs 51.38), suggesting different content consumption patterns between the target audiences. Both ads show strong performance on social media channels, indicating digital-first strategy potential.
This data can then be synthesized to create strategic recommendations that can be used for campaign planning and overall communication and go-to-market strategies. For example:
Household-Level Complementary Targeting
Leverages the strong gender-specific appeal patterns
Creates opportunities for bundled promotions and "His & Hers" campaigns
Focuses on households with $150k+ combined income
Digital Channel Mix Optimization
Channel-specific allocation based on performance data
Platform-specific creative adaptations
Cross-promotion strategy for shared channels
Geo-Targeted Premium Expansion
Concentration in top-performing urban and coastal markets
Geo-fencing in luxury retail districts
City-specific limited editions for high-performing markets
Age-Cohort Content Optimization
Creative variations targeting peak demographics
Youth platform integration for Sauvage
Sequential messaging strategies matching decision journeys
Affluent Experience Enhancement
Exclusive experiences for high-income segments
Private digital showrooms for $200k+ income brackets
Cross-product clienteling programs
Taking it to the Next Level via Statistical Analysis
Elevating insights through advanced statistical and machine learning analysis of synthetic data, we reveal complex multidimensional relationships that illuminate how different audience segments interact. This sophisticated understanding enables precisely targeted messaging customized for specific cohorts, significantly enhancing engagement rates. The visualization demonstrates how different political affiliations naturally cluster together based on similarity. Affiliations positioned closer to each other share more ideological commonalities, while those positioned farther apart represent more divergent political perspectives.
Cluster Map of Political Affiliations of Modeled Organizations
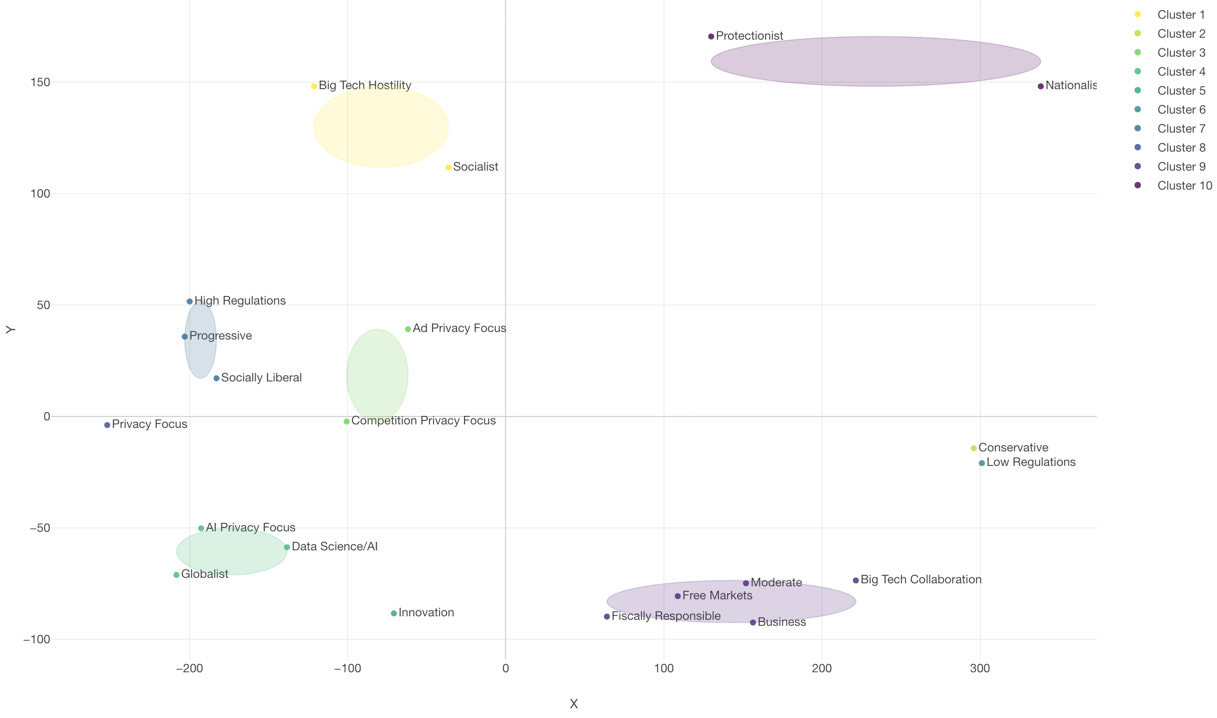
This cluster and distance map reveals distinct ideological groupings across the political landscape. The horizontal (X) axis represent economic policy positions, with regulatory approaches on the left and free-market approaches on the right. The vertical (Y) axis seems to represent cultural and sovereignty perspectives, with nationalist/protectionist views toward the top and globalist/cosmopolitan views toward the bottom.
Key Clusters Identified:
Cluster 1 (Yellow) - Upper-left quadrant, representing Big Tech Hostility and Socialist coalition, an anti-corporate, left-leaning group favoring tech regulation.
Cluster 2 (Light Green) - Center-left, encompassing Progressive, High Regulations, and Socially Liberal positions, a mainstream left-of-center coalition supporting activist government and social liberalism.
Cluster 3 (Green) - Centered around the origin, featuring Ad Privacy Focus, Competition Privacy Focus, and AI Privacy Focus, indicating a techno-regulatory centrist position on privacy and competition.
Cluster 4 (Teal) - Lower-left quadrant, grouping Globalist, Data Science/AI, and Innovation, a pro-technology, international-minded progressive coalition.
Cluster 10 (Purple) - Upper-right, showing Protectionist and Nationalist positions, an economically nationalist, sovereignty-focused bloc.
Cluster 9 (Light Purple) - Center-right, containing Moderate, Free Markets, Business, Fiscally Responsible, and Big Tech Collaboration positions, a business-friendly, moderate conservative coalition.
While this example specifically illustrates political affiliations, these same analytical techniques can be applied across various contexts to identify patterns of similarity and difference between demographic groups, communication channels, and stakeholder communities.
Reverse Engineer Engagement
Through systematic analysis of engagement metrics (views, retweets, likes, and interactions), we can identify patterns that correlate with specific content characteristics. By examining these metrics against topical trends, political affiliations, and psychological factors like framing effects, we develop predictive models for audience engagement. This analytical approach allows us to reverse-engineer successful engagement strategies for any demographic that drive meaningful communications.
Statistically Analysis and Correlation of Modeled Political Ideologies
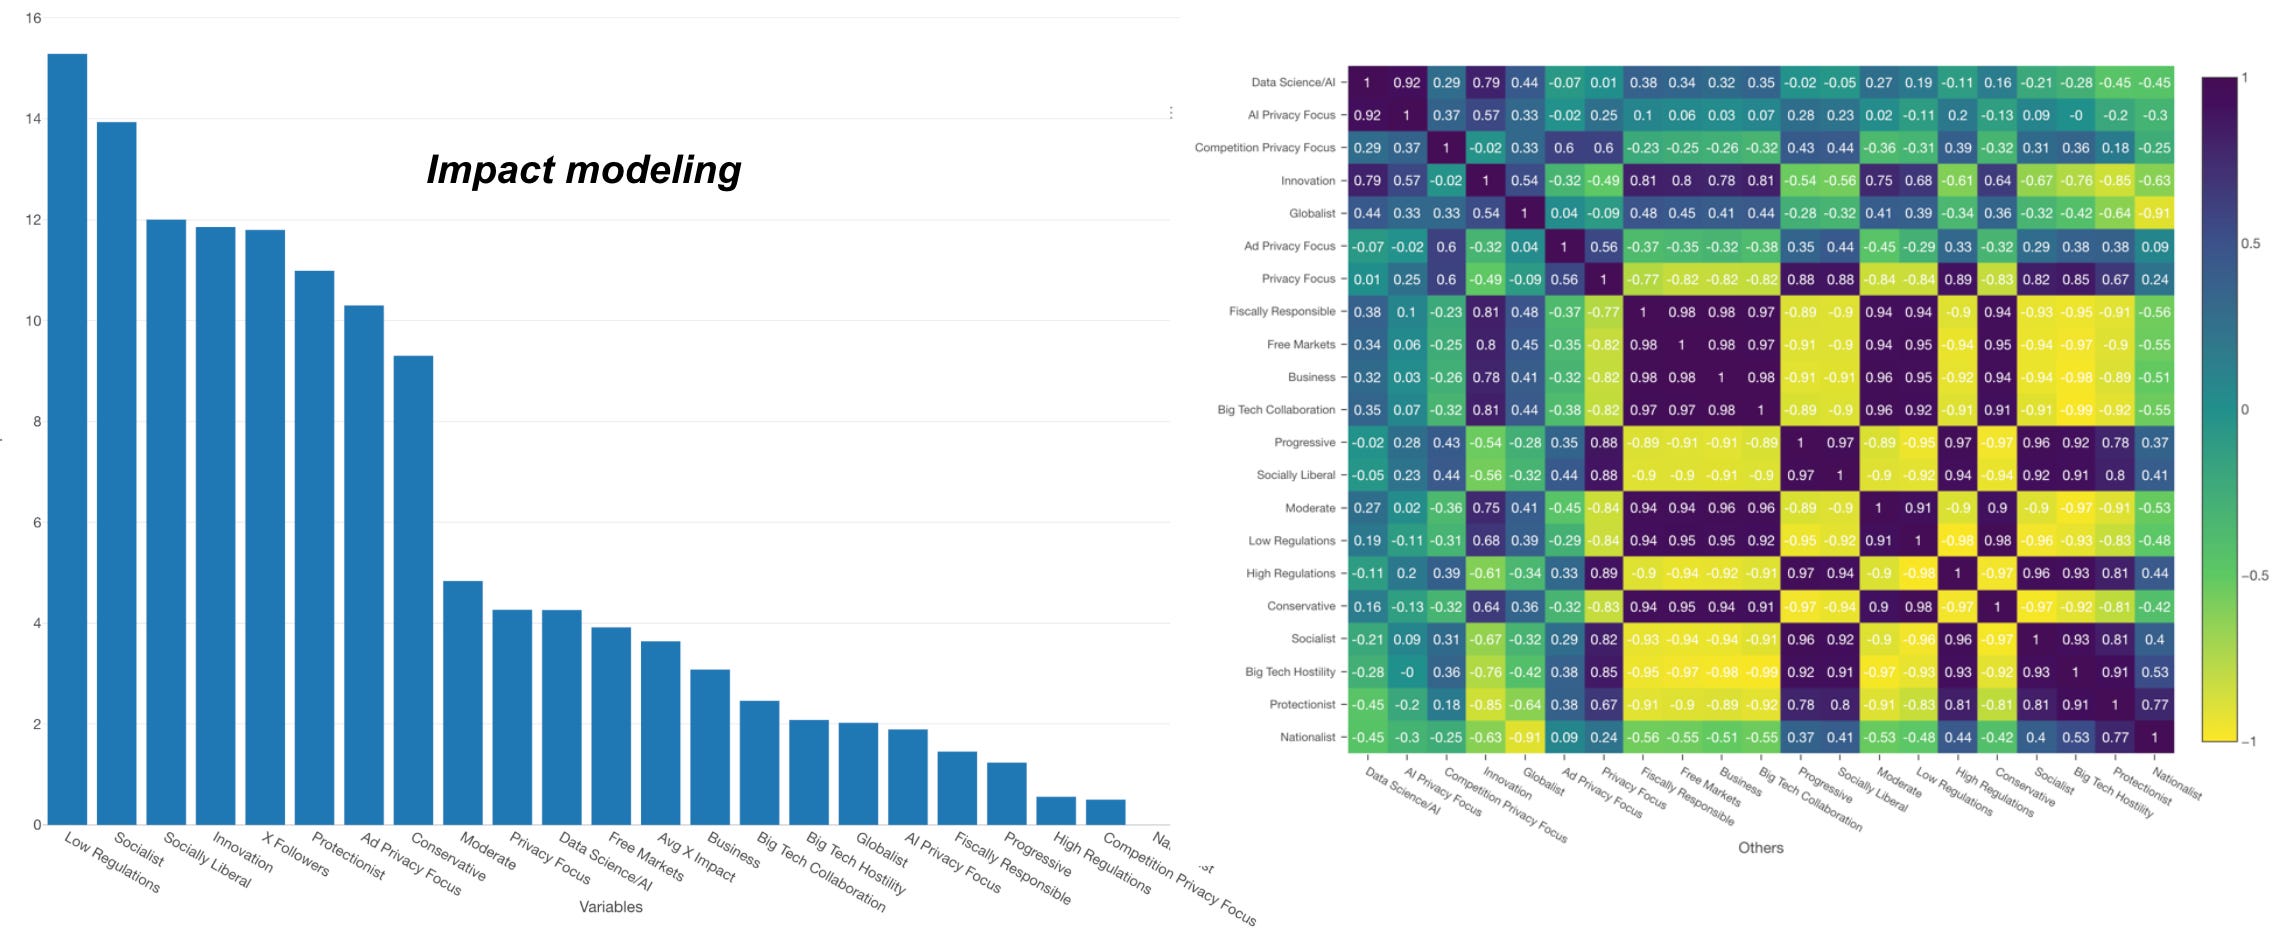
In this specific case, our synth models shows that positions on regulation and socialism serve as the strongest predictors of political orientation. These indicators outperform other variables in forecasting policy preferences and provide a reliable framework for understanding political positioning across the spectrum.
The Future of Communication & Marketing
As digital communication becomes increasingly sophisticated and audience attention more fragmented, the ability to precisely predict and optimize message performance will separate market leaders from followers. SynthLens represents this evolution, enabling organizations to identify emerging trends through real-time behavioral pattern analysis, reduce campaign risk through comprehensive pre-launch testing, and accelerate innovation cycles with rapid iteration capabilities.
Organizations ready to transform their communication strategy through synthetic intelligence can begin with a strategic consultation to explore how SynthLens addresses their specific challenges. Whether optimizing political messaging, launching consumer products, or repositioning established brands, the platform provides the analytical foundation for confident decision-making in an increasingly complex communication landscape.
The question is no longer whether synthetic focus groups will replace traditional research methods, but how quickly organizations will adopt these capabilities to maintain competitive advantage in their markets. SynthLens provides that strategic advantage today, delivering the precision and speed required for effective communication in the modern marketplace.